Monitoring JVM with Prometheus in K8S (I)
Operation Scenarios
The Prometheus community has developed the JMX Exporter to export JVM monitoring metrics for use with Prometheus to capture monitoring data. Learn how to use Prometheus with JMX Exporter to monitor Java applications once your Java business has been containerized to Kubernetes in this article.
Introduction to JMX Exporter
Java Management Extensions, JMX, is an extension framework for managing Java, and JMX Exporter is based on this framework for reading the runtime state of the JVM. JMX Exporter uses Java’s JMX mechanism to read JVM runtime monitoring data and convert it to Prometheus-aware metrics format so that Prometheus can monitor and collect it.
JMX Exporter provides two ways to expose JVM monitoring metrics, starting a standalone process and in-process (in-process) JVM.
- Start standalone process
JMX Exporter calls RMI to get JVM runtime state data, converts it to Prometheus metrics format, and exposes the port for Prometheus to collect. 2. - JVM in-process startup (in-process)
Specify the parameters when the JVM starts, run the JMX Exporter jar package as a javaagent, read the JVM runtime state data in-process, convert it to Prometheus metrics format, and expose the port for Prometheus to collect.
Description.
Officially, it is not recommended to use the start independent process approach, which is complex to configure and requires a separate process, and the monitoring of the process itself raises new issues. This article takes the JVM in-process startup (in-process) approach as an example, using JMX Exporter to expose JVM monitoring metrics in a Kubernetes environment.
Steps
Expose JVM monitoring metrics using JMX Exporter
The JMX Exporter jar package and configuration file should be specified when starting the JVM using the in-process method. jar package is a binary file, which is not convenient to mount via ConfigMap, so it is recommended to package the JMX Exporter jar package and configuration file into the business container image directly.
Here for demonstration purposes, the jar package is simply mounted directly into the container using hostPath, and the configuration file is mounted into the container using the ConfigMap form.
Preparing jar packages and configuration files
Prepare the jar package file, you can go to the Github page of jmx_exporter to get the latest jar package download address. Execute the following command to download to the
hostPathdirectory specified by the mount.$ mkdir -p /data/prometheus/jmx_exporter
$ wget -O /data/prometheus/jmx_exporter/jmx_prometheus_javaagent-0.15.0.jar https://repo1.maven.org/maven2/io/prometheus/jmx/jmx_prometheus_javaagent/0.15.0/jmx_prometheus_javaagent-0.15.0.jarwrite the JMX Exporter configuration file
prometheus-jmx-config.yaml.apiVersion: v1
kind: ConfigMap
metadata:
name: prometheus-jmx-config
namespace: default
data:
prometheus-jmx-config.yaml: |
lowercaseOutputLabelNames: true
lowercaseOutputName: true
whitelistObjectNames: ["java.lang:type=OperatingSystem"]
blacklistObjectNames: []
rules:
- pattern: 'java.lang<type=OperatingSystem><>(committed_virtual_memory|free_physical_memory|free_swap_space|total_physical_memory|total_swap_space)_size:'
name: os_$1_bytes
labels: {}
type: GAUGE
attrNameSnakeCase: true
- pattern: 'java.lang<type=OperatingSystem><>((?!process_cpu_time)\w+):'
name: os_$1
labels: {}
type: GAUGE
attrNameSnakeCase: trueNote that.
For more configuration items, please refer to the Prometheus official documentation.
Deploying Java Applications
When deploying an application to Kubernetes, you need to modify the JVM startup parameters to load the JMX Exporter on startup. The JVM will read the JAVA_OPTS environment variable as an additional startup parameter, which can be added to the application during deployment.
- The startup parameter format:
-javaagent:<jar>=<port>:<config> - This example uses port 8088 to expose the JVM monitoring metrics, which you can change as needed.
The following is an example of Tomcat.
Write the
Deploymentfile for tomcat.apiVersion: apps/v1
kind: Deployment
metadata:
name: tomcat
namespace: default
spec:
replicas: 2
selector:
matchLabels:
app: tomcat
template:
metadata:
labels:
app: tomcat
spec:
containers:
- name: tomcat
image: tomcat:jdk8-openjdk-slim
env:
- name: JAVA_OPTS
value: "-javaagent:/jmx_prometheus_javaagent-0.15.0.jar=8088:/jmx/prometheus-jmx-config.yaml"
resources:
requests:
cpu: 300m
memory: 512Mi
limits:
cpu: 500m
memory: 1024Mi
volumeMounts:
- mountPath: "/jmx_prometheus_javaagent-0.15.0.jar"
name: jmx-prometheus-javaagent
- mountPath: "/jmx"
name: prometheus-jmx-config
volumes:
- name: jmx-prometheus-javaagent
hostPath:
path: /data/prometheus/jmx_exporter/jmx_prometheus_javaagent-0.15.0.jar
- configMap:
name: prometheus-jmx-config
name: prometheus-jmx-configWrite the
Servicefile for tomcat.apiVersion: v1
kind: Service
metadata:
name: tomcat
labels:
app: tomcat
annotations:
prometheus.io/port: "8088"
prometheus.io/jvm: "true"
spec:
type: NodePort
selector:
app: tomcat
ports:
- name: http
port: 8080
protocol: TCP
- name: jmx-metrics
port: 8088
protocol: TCPNote.
The
annotationsfield added to the Service is to do some retagging of tags in theRawJobsof the Promethues profile, etc.
Add Prometheus monitoring configuration
Configure Prometheus so that monitoring data can be collected. The example is as follows.
- job_name: jvm |
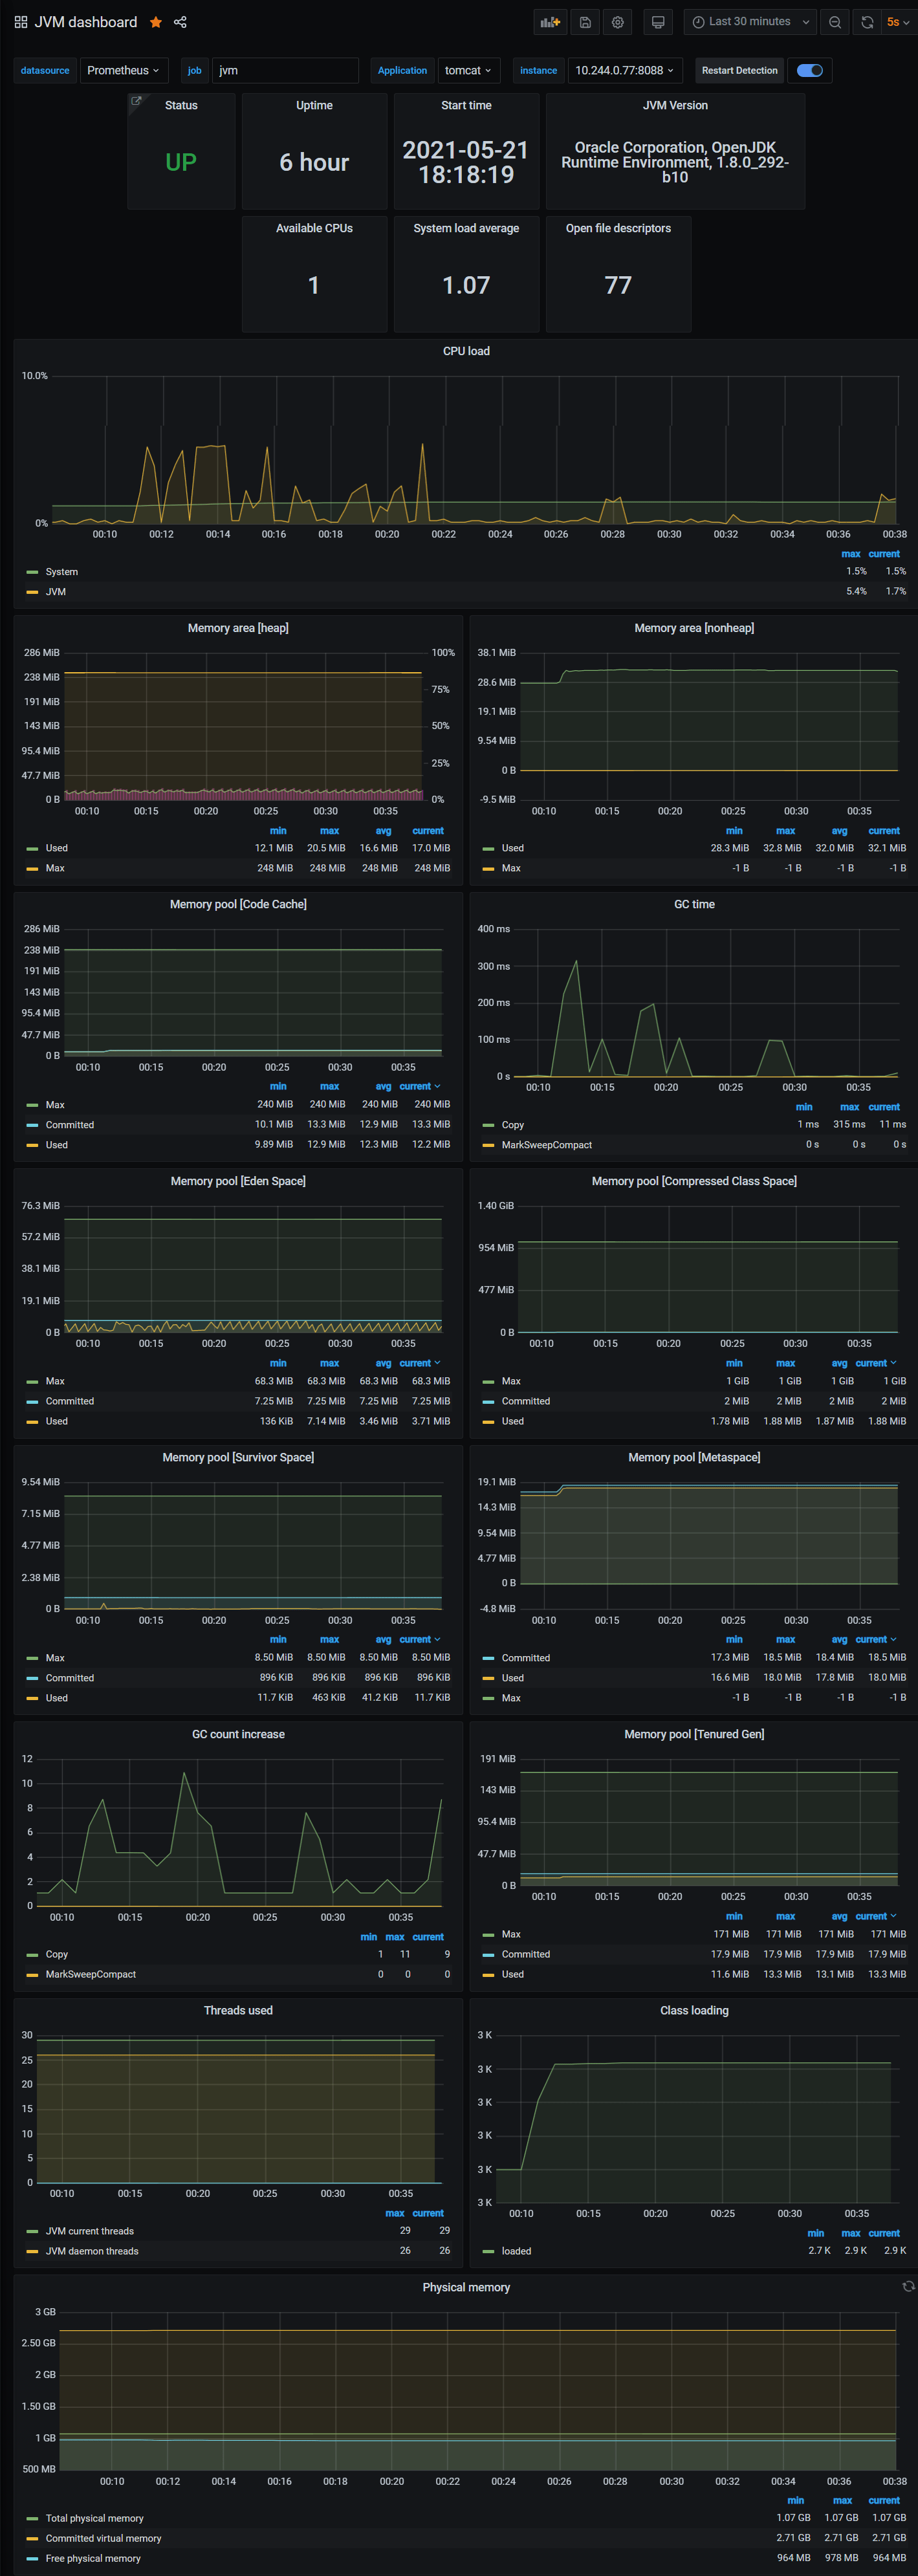
Add Grafana monitoring panel
The data can be displayed after it is collected. If you are familiar with Prometheus and Grafana, you can design your own dashboard based on the metrics you need. You can also use a community provided dashboard such as the JVM dashboard. You can import and use it directly.
The above Dashboard, however, has some parts that are not very user-friendly to use, so some modifications have been made on its basis.
Template download link, after downloading it, the json of the file is directly The contents are copied into Grafana, and the panel effect is shown as follows.
Note.
Since this Dashboard is customized from RawJobs in Promethues, if you want to use this Dashboard, the RawJobs rules in Prometheus need to be consistent with the text, and it is recommended not to modify them. Otherwise, some functions may not work. (Of course, if you are familiar with Promethues, you can also adjust it according to your needs)
Reference
 微信
微信 支付宝
支付宝