Monitoring JVM with Prometheus in K8S (II)
Background Notes
In the previous article Monitoring JVM with Prometheus in K8S (I), we implemented a service based on Kubernetes to monitor the JVM information of java in Pods. JVM information of the application in the Pod. However, this does not apply to all environments, because not all Pods (microservices) have their own Service in the real world, so those Pods that do not use the Service cannot monitor JVM information with the same kind of implementation as in the previous article. Now let’s solve this problem.
This article will be based on the Pod controller to implement the JVM information monitoring, the following Deployment controller as an example.
Steps
Expose JVM monitoring metrics using JMX Exporter
The JMX Exporter jar package and configuration file should be specified to start the JVM in-process. jar package is a binary file, which is not convenient to mount via ConfigMap, so it is recommended to package the JMX Exporter jar package and configuration file into the business container image directly.
Here for demonstration purposes, the jar package is simply mounted directly into the container using hostPath, and the configuration file is mounted into the container using the ConfigMap form.
Preparing jar packages and configuration files
Prepare the jar package file, you can go to the Github page of jmx_exporter to get the latest jar package download address. Execute the following command to download to the
hostPathdirectory specified by the mount.$ mkdir -p /data/prometheus/jmx_exporter
$ wget -O /data/prometheus/jmx_exporter/jmx_prometheus_javaagent-0.15.0.jar https://repo1.maven.org/maven2/io/prometheus/jmx/jmx_prometheus_javaagent/0.15.0/jmx_prometheus_javaagent-0.15.0.jarwrite the JMX Exporter configuration file
prometheus-jmx-config.yaml.apiVersion: v1
kind: ConfigMap
metadata:
name: prometheus-jmx-config
namespace: default
data:
prometheus-jmx-config.yaml: |
lowercaseOutputLabelNames: true
lowercaseOutputName: true
whitelistObjectNames: ["java.lang:type=OperatingSystem"]
blacklistObjectNames: []
rules:
- pattern: 'java.lang<type=OperatingSystem><>(committed_virtual_memory|free_physical_memory|free_swap_space|total_physical_memory|total_swap_space)_size:'
name: os_$1_bytes
labels: {}
type: GAUGE
attrNameSnakeCase: true
- pattern: 'java.lang<type=OperatingSystem><>((?!process_cpu_time)\w+):'
name: os_$1
labels: {}
type: GAUGE
attrNameSnakeCase: trueNote that.
For more configuration items, please refer to the Prometheus official documentation.
Deploying Java Applications
When deploying an application to Kubernetes, you need to modify the JVM startup parameters in order to load the JMX Exporter at boot time.
An additional parameter needs to be added to the JVM startup parameters in the following format.
- Startup parameter format:
-javaagent:<jar>=<port>:<config>
Configure the Deployment file
Mount the jmx exporter configuration file and jar package.
First, you need to mount the jar package and ConfigMap into Deployment (adjust the road force by yourself).
volumeMounts: |
Enable jmx exporter by adding the following configuration to the startup parameters.
-javaagent:/jmx_prometheus_javaagent-0.15.0.jar=8088:/jmx/prometheus-jmx-config.yaml
Add a new tag, in order to make it easier to do matching in Promethues.
Add a new label under
deployment.spec.template.metadata.labels.as followsprometheus.monitor/port: "8088"
prometheus.monitor/jvm: "true"
Deployment Full Example
The following is an example of an Eureka service in Spring Cloud.
apiVersion: apps/v1 |
Note.
annotationsfield added in Deployment to do some retagging of tags in theRawJobsof the Promethues configuration file, etc.
Add Prometheus monitoring configuration
Configure Prometheus so that monitoring data can be captured.
Add the following RawJob configuration to the configuration file: ``yaml
- job_name: jvm |
Using Grafana out of the chart
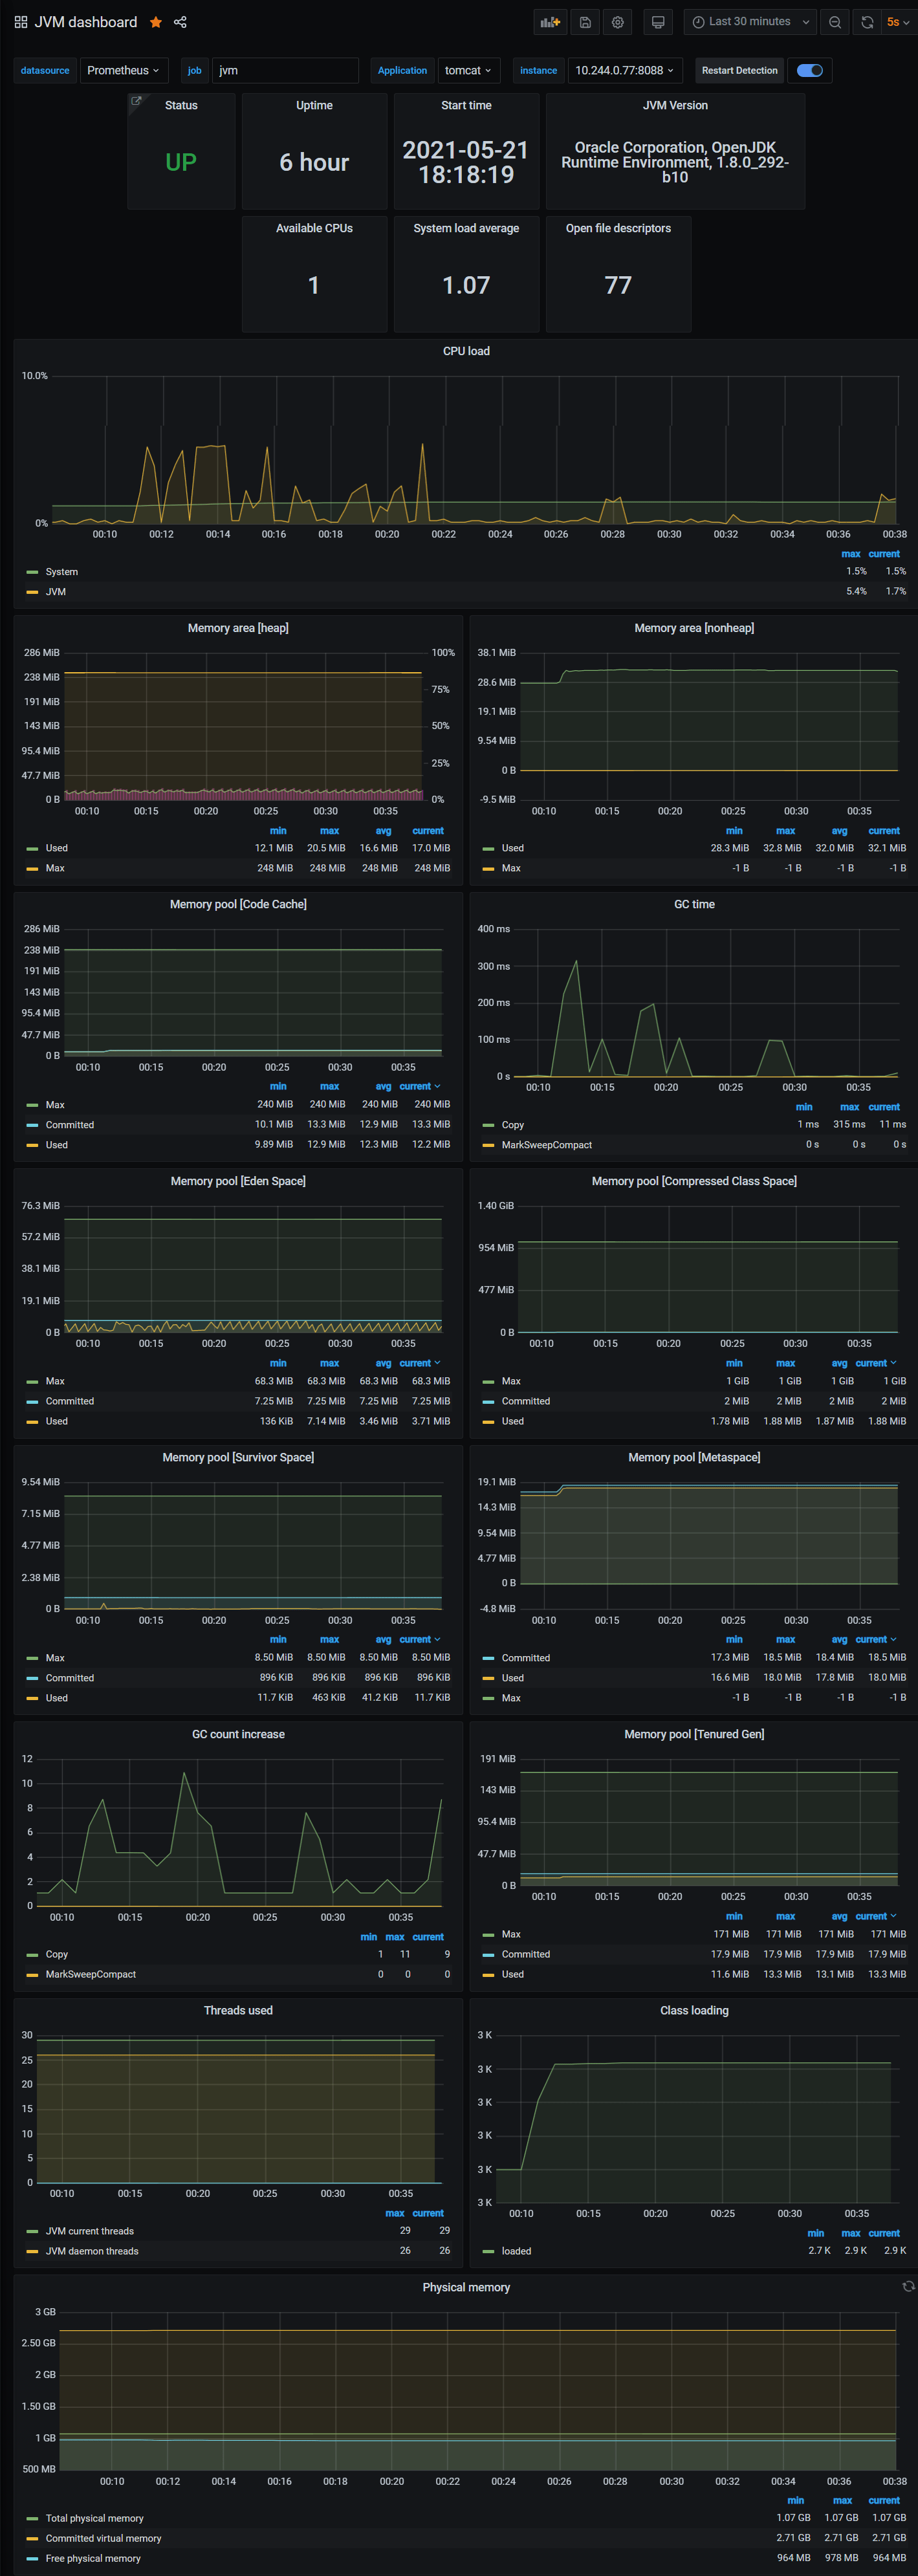
Template download link, after downloading directly the file’s json The content is copied and imported into Grafana, the panel effect image is as follows.


